Avocado Size Preference in US Cities: Principal Component Analysis (PCA) of Volumetric Sales of Avocados in 2020
The project focused on in-depth exploratory data analysis to uncover trends and preferences in avocado sizes across major US cities. By applying the PCA to volumetric sales data of avocados in three different sizes (small, medium, and large) in 2020 categorized by PLUs 4046, 4225, 4770, respectively, a distinct preference for either small or medium-sized avocados in most cities was revealed, with outliers showing higher sales in all three sizes. The project was implemented using Python, and the dataset was sourced from www.kaggle.com. I opted to analyze this dataset because of my personal fondness for avocados, especially as I include avocado toast in my daily breakfast routine. My preference for using the entire avocado for the toast and my reluctance to store cut avocados for the next day lead me to favor small-sized avocados. However, I occasionally encounter challenges in finding small-sized avocados sold under PLU 4046 at my usual grocery store. This curiosity prompted me to delve into the trends of preferences in avocado sizes in US cities.
Principal Component Analysis (PCA)
The principal component analysis, or PCA, is used to analyze data that has a large number of features. The goal is to represent the higher-dimensional data in lower dimensions while minimizing the loss of information and simultaneously improving the interpretability of the data. The key idea is to find an ordered basis with a dimension less than that of the initial data such that when the initial data is represented in the new ordered basis, the first basis vector is the direction of the maximum variance of the data than the second, and so on. This is done by standardizing the data and then computing the singular value decomposition (SVD) of the dataset.
Given that $U \Sigma V^T$ = $X$, the columns of $U$ form the new ordered basis. The order of the basis vectors is given by the descending order of the magnitude of the singular values. The most variance in the data is observed in the direction given by the first column of the $U$ matrix, and the direction of the least variance in the data is given by the last column of the $U$ matrix. The columns of the $\Sigma V^T$ represent the coordinates of each column of the data matrix $X$ in the new ordered basis.
Results
Discussion
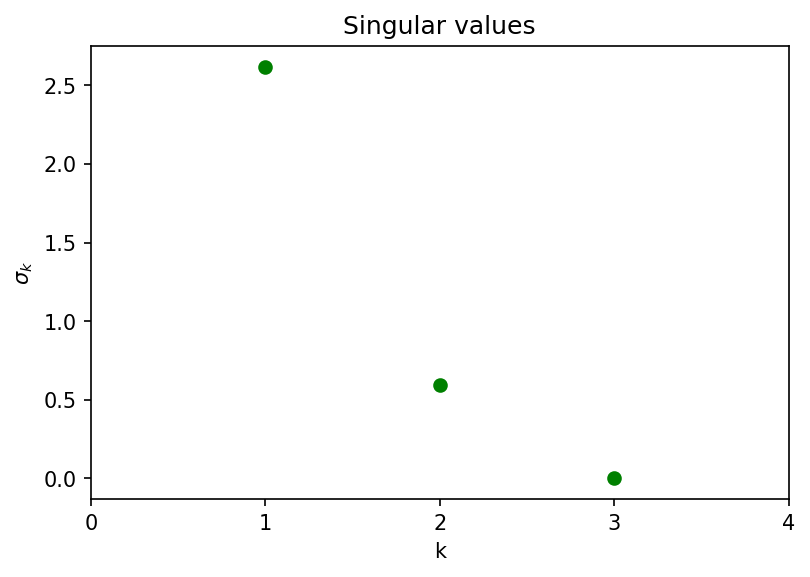
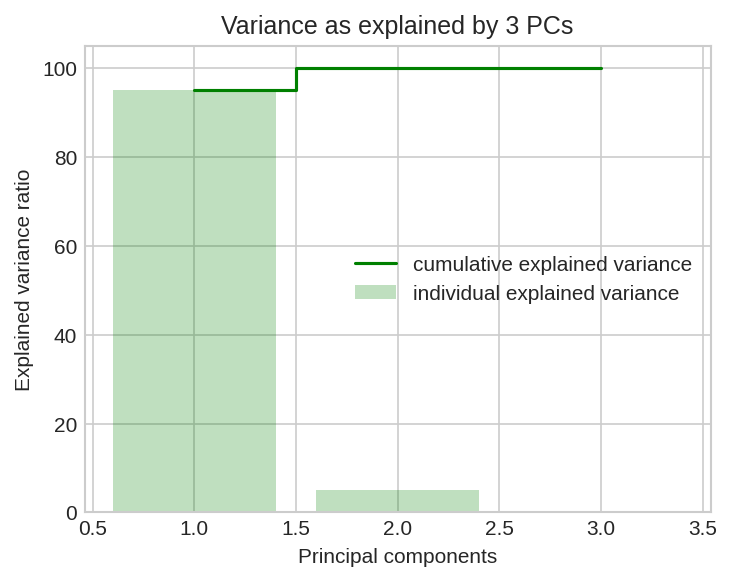
From the figure that shows the singular values, it is interesting to note that the third singular value ($\sigma_3$) is 0. This implies that the variance in the data is fully explained by the first 2 principal components (PCs). Precisely, the first PC explains $95.075\%$ of the variance. The first PC and the second PC cumulatively explain $100\%$ of the variance in the data. This is also seen in the figure that shows the variance explained by the PCs.
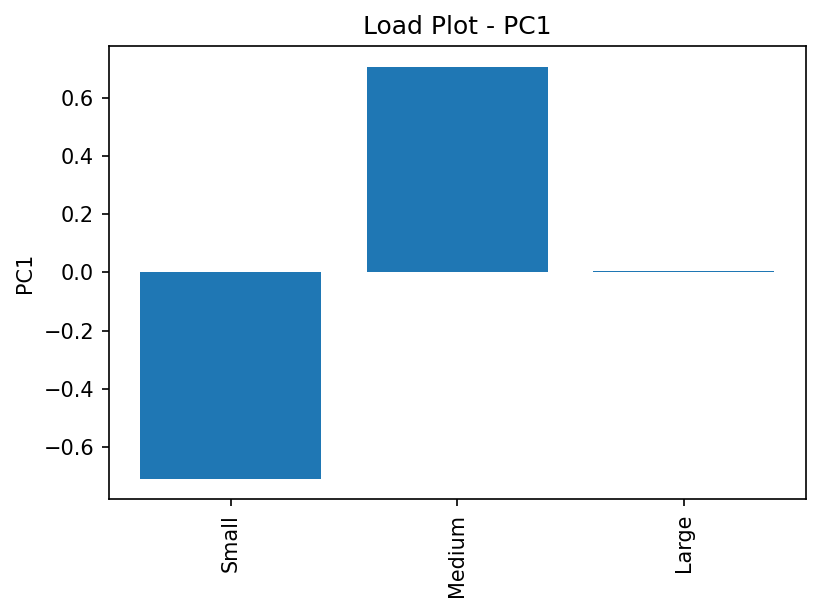
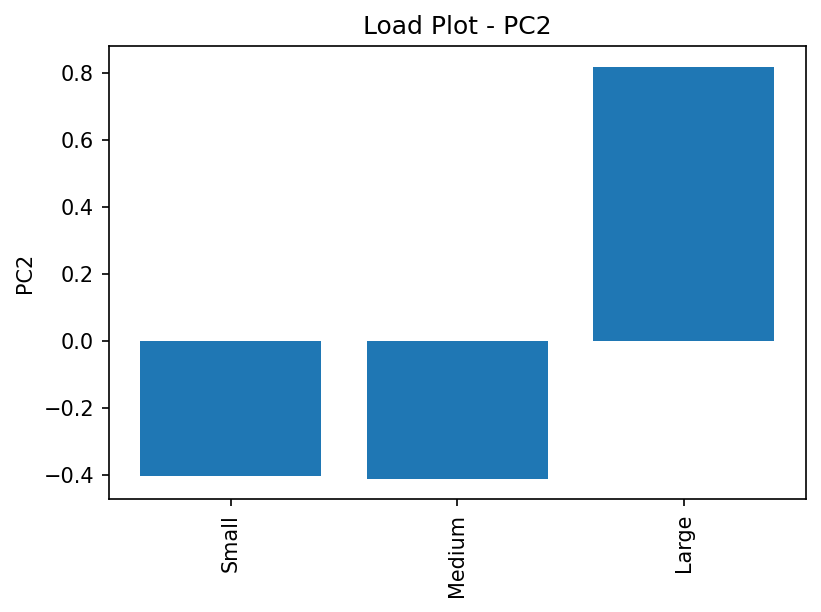
To comprehend the underlying rationale, examining the load plots of the two principal components (PCs) is instrumental. The load plot of PC1 reveals significant absolute values for its first two components, with the third component registering as 0. Conversely, the load plot of PC2 illustrates that the third component holds the highest absolute value. Additionally, given the knowledge that $\sigma_1 > \sigma_2 > \sigma_3 = 0$, we can deduce that there are essentially two distinct city groups: one characterized by a dominance in the sales of small and medium-sized avocados, and another where sales across all three sizes are more evenly distributed. Consequently, the first two PCs elucidate the entirety of the variance in the data, accounting for a comprehensive $100\%.$
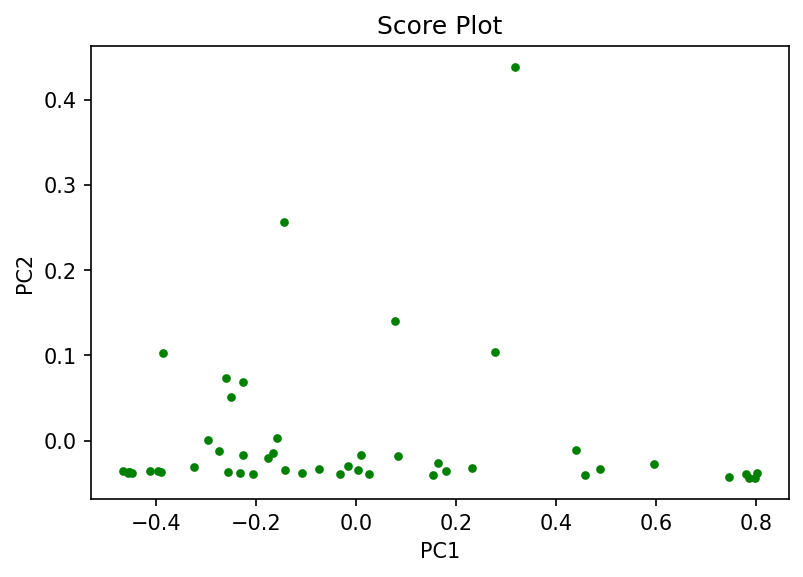
The score plot confirms that the majority of variance in the data is in direction of the PC1 while some noticeable variance is in the PC2 direction.
Evaluation
In my view, PCA proves to be a suitable tool for analyzing the dataset under consideration. As highlighted in the results, PCA provides a clear insight into how cities can be effectively grouped based on volumetric sales relative to the sizes of avocados. I hypothesize that if a linear regression were conducted on this dataset ($X$), the optimal fit line would align predominantly with the direction of PC1. Given that PC1 accounts for the majority of the variance in the data, it leads me to the conclusion that in numerous cities, the sales of small and medium-sized avocados take precedence. This observation offers an explanation for the occasional difficulty in finding small-sized avocados at my usual grocery store.